ExplainSpeaking: Why Govt of India is wrong to claim inflation hit the rich more than the poor
[ad_1]
ExplainSpeaking-Economy is a weekly newsletter by Udit Misra, delivered in your inbox every Monday morning. Click here to subscribe
Dear Readers,
Last week, India’s Finance Ministry claimed that “inflation in India has a lesser impact on low-income strata than on high-income groups”. In other words, the poor in India were less adversely impacted by rising prices than the rich.
The claim, published in the Monthly Economic Review (MER) for April, which is brought out by the Department of Economic Affairs in the Union Ministry of Finance, also went on to assert that inflation in India was such that it “reinforced the favourable redistribution of the income from top to bottom and middle-income group.” In other words, not only did high inflation not hurt the poor as much as it hurt the rich, but it also became a vehicle to reduce inequality between the rich and the poor in the country.
Is this true?
The short answer is: This is false.
The long answer is more illuminating but before explaining how the Finance Ministry got it wrong, here’s a detailed look at how it arrived at these conclusions.
How did the government arrive at this conclusion?
On page 13, the MER has carried an information box titled “Assessment of headline inflation across different expenditure groups”. The relevant MER can be downloaded by clicking here. In this box, the government correctly argues that the Consumer Price Index-based inflation affects consumers and households “in a manner consistent with their expenditure patterns and shares”. In other words, while the overall price level may have gone up by, say 10%, it affects different people differently based on what they consume more and where they spend their money. It is possible, thus, to imagine that if the overall price level has gone up primarily because of a sharp increase in food (vegetables, fruits etc.) prices then the household that spends 90% of all its monthly income on food will be more affected than the household that spends only 30% of its income on food.
As explained in an article last week, often overall inflation is typically broken into three sub-groups:
1> Food and beverages
2> Fuel and light
3> Core items (all the remaining items)
The MER also does the same. As explained in the piece last week, the overall or headline retail inflation is driven by varying levels of inflation within these categories.
To understand the impact of inflation on the population, the government has divided the whole population into three categories based on expenditure data that is sourced from the 68th round of the National Sample Survey (NSS) on Household Consumer Expenditure, 2011-12:
1> The Top 20% (or the rich)
2> The Middle 60% (the middle class)
3> The Bottom 20% (the poor)
It further differentiated this population into rural and urban as well to get a thorough understanding of which specific segment of India’s population suffered the most due to high inflation — was it the rural poor or the urban rich or rural middle class etc.
This set of pie charts shows the distribution of expenditure across different types of people.
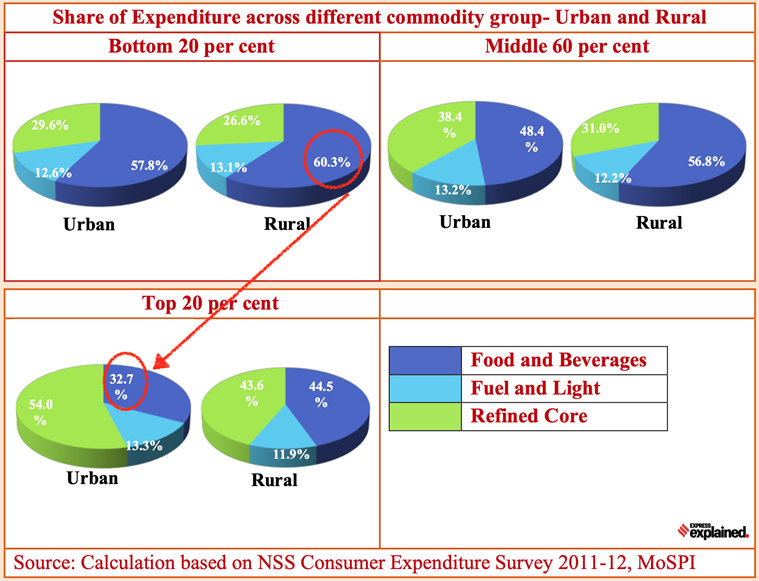 Pie charts: The distribution of expenditure across different types of people
As can be seen, there are striking differences. For instance, while the rural poor spend more than 60% of their total expenditure on food items, the urban rich spend less than 33% on food and beverages. These distributional differences are significant because a spike in food inflation will create higher effective inflation for the rural poor than it would for the urban rich.
Based on these differences in expenditures as well as the inflation prevailing in those commodities, the government arrived at the following (see the set of charts below) effective inflation rates for each population group for both the years — 2020-21 (or FY21 — the year when Covid first hit India) and 2021-22 (or FY22 — the year when India’s economy staged a recovery)
 Charts: The effective inflation rates for each population group for the years 2020-21 and 2021-22.
A few things stand out:
1> Inflation rates faced by almost all categories of people (barring the rural rich) were higher in FY21 than in FY22. This was in line with the fact that the headline CPI inflation decreased from 6.2 per cent in FY21 to 5.5 per cent in FY22.
2> Further, in urban areas, the biggest reduction in the inflation rate (from 6.8% in FY21 to 5.7% in FY22) is observed among the poor and the middle group. The rich also faced a reduction but the quantum was lower — just 80 basis points — from 6.5% to 5.7%.
3> Similarly, in rural India, too, the biggest reduction in the inflation rate was witnessed among the poor. In fact, the rural rich saw their inflation rate go up marginally between FY21 and FY22.
Using the last two observations, the Finance Ministry officials have concluded: “Therefore, it can be inferred from the above analysis that lower inflation has reinforced the favourable redistribution of the income from top to bottom and middle-income group.”
Why is this the wrong conclusion to draw?
To understand this one must revisit what inflation is and how it plays out.
The inflation rate for any year is the rate at which the price level goes up when compared to the prices in the preceding year.
Imagine that, to begin with, the general price level is Rs 100.
Then suppose the inflation rate in the first year is 10% and in the second year is 8%.
What do you think the price level will be at the end of the first and the second years?
It will be Rs 110 at the end of the first year and Rs 118.8 at the end of the second year. The last Rs 0.8 is crucial because prices have gone up 8% on Rs 110 (and not on Rs 100).
In other words, high inflation in Year 1 continues to play a role in pushing up prices in Year 2.
Assuming that prices were Rs 100 at the start of FY21 and applying the effective inflation rates faced by the rich and poor in urban and rural areas, we get the following price levels (see Table 1).
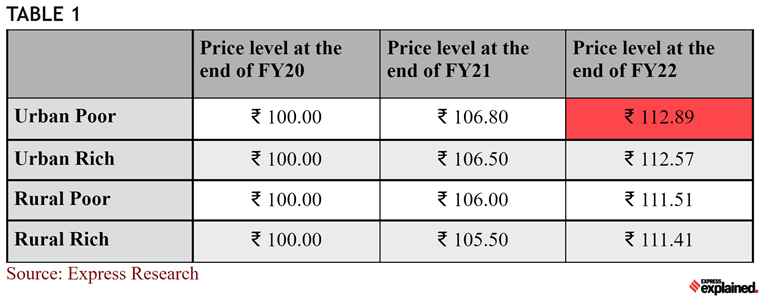 If the prices were Rs 100 at the start of FY21, here’s what the price levels will be at the end of FY22 after applying the effective inflation rates.
And it is clear that at the end of FY22, it is the urban poor who are the worst affected by inflation in India.
Is there any corroborating evidence to suggest that the urban poor were worse off?
As it happens there is. A similar exercise has been done by CRISIL Research based on the same data from the 68th round of the National Sample Survey (NSS) on Household Consumer Expenditure, 2011-12.
Table 2 below confirms the results.
 Table 2: The urban poor have borne the maximum brunt of inflation after the pandemic.
The CRISIL Research note stated: “Mapping these expenditure patterns with current inflation trends reveals that the urban poor have borne the maximum brunt of inflation after the pandemic.”
Are the poor always worse off because of inflation? If so, then why?
At one level it is quite bizarre for the Finance Ministry to claim that high inflation over the past two years hurt the rich more than the poor. Even more befuddling is to conclude that high inflation reduced existing inequalities in the Indian economy.
Not only is this incorrect, as shown above, but it also flies in the face of a large body of academic literature that has repeatedly shown that the poor end up suffering the most when inflation spikes.
For instance, a 2001 paper titled “Inflation and the poor” by William Easterly (at that time with the World Bank) and Stanley Fischer (at the time with the IMF) — published in the Journal of Money, Credit, and Banking — tried to test the claim that “inflation is the cruelest tax of all” because it hurts the poor relatively more than the rich.
“The essential a priori argument is that the rich are better able to protect themselves against, or benefit from, the effects of inflation than are the poor,” state the two stalwarts in the paper. For instance, the poor often keep most of their money as cash — and inflation robs cash of its purchasing power — while the rich have the ability and opportunity to keep their wealth in financial instruments (say stock markets or real estate) that negate the effect of inflation. Similarly, the poor often save far less than the rich and, as such, have a relatively smaller buffer to deal with inflationary spikes. Then there is the issue of remuneration. The poor typically are dependent on wages — which often may not keep up with the inflation rate when prices rise sharply and suddenly.
Easterly and Fischer went about establishing inflation’s effect on the poor empirically. They did this in two ways.
First, they drew on the results of a global survey of 31,869 individuals in 38 countries, which asked whether individuals think inflation is an important national problem. This provided an indirect way of getting at the issue of whether inflation is more of a problem for the poor than for the rich.
Second, they assessed the effects of inflation on direct measures of inequality and poverty in various cross-country and cross-time samples.
Here’s what they concluded: “Our evidence supports the views that inflation is regarded as more of a problem by the poor than it is by the non-poor, and that inflation appears to reduce the relative income of the poor. It thus adds to a growing body of literature that on balance but not unanimously tends to support the view that inflation is a cruel tax.”
Their paper also referred to a 1996 study on India by Gaurav Datt and Martin Ravallion — titled “Why Have Some Indian States Done Better Than Others at Reducing Rural Poverty?” — that found observations with higher inflation rates also had higher poverty rates.
Share your views and queries at udit.misra@expressindia.com
Stay safe,
Udit
Newsletter | Click to get the day’s best explainers in your inbox
[ad_2]
Source link


