ExplainSpeaking: 11 charts from RBI that explain Indian economic past, present and future
[ad_1]
ExplainSpeaking-Economy is a weekly newsletter by Udit Misra, delivered in your inbox every Monday morning. Click here to subscribe
Dear Readers,
Last week, the RBI released this year’s “Report on Currency and Finance“. It immediately caught everyone’s attention for stating that as an economy “India is expected to overcome Covid-19 losses in 2034-35”. This statement not only has several implications but is also based on some critical assumptions, which, if tweaked, can make this projection even worse.
Moreover, while most of the attention has been on this one statement, what is perhaps even more relevant is what the RBI report says about the state of India’s economic growth in the lead up to the Covid pandemic.
In both the cases — pre-Covid growth as well as post-Covid recovery — what stands out about the RBI report is the refreshingly candid assessment of the true state of the economy, especially since its assessment is in stark contrast to what the government has been projecting.
The past (or the pre-Covid reality)
Some of the biggest, albeit unnecessary, points of contention in the pre-Covid years have been the government’s unwillingness to accept that:
- The Indian economy had been slowing down since the announcement of demonetisation
- That this slowdown was driven by a slowdown in personal consumption demand
- That employment had been faltering
- Even as the growth rate of wages was slowing down
But the latest RBI report sets the record straight using official data.
1) On overall economic growth, the report “begins by taking a deep dive into Covid-induced downturn in the economy against the backdrop of the loss of pace in activity, evident since H2 of 2016-17 and its structural and cyclical drivers.”
Although it does not specifically name the demonetisation of November 2016, it is noteworthy that the RBI clearly specifies the second half (H2 in the quote above) of 2016-17 — which essentially refers to the period between October 2016 and March 2017 — as the start of the slowdown.
Look at the data highlighted in CHART 1. The GDP growth between 2017 and 2020 was just 5.7% — exactly the same as it was during the last three years of the UPA rule (2011 to 2014).
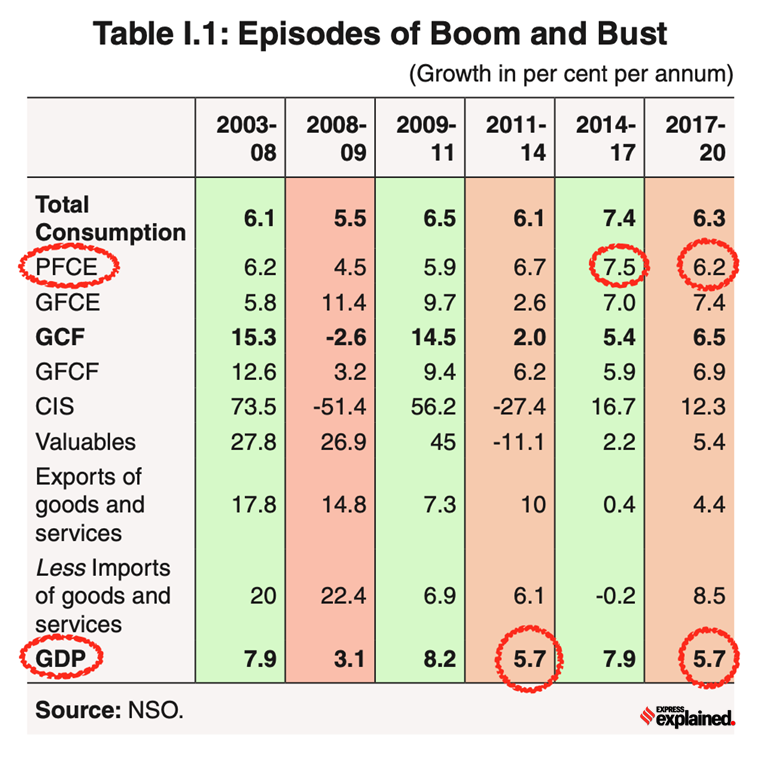 Chart 1: The GDP growth between 2017 and 2020 was just 5.7%
2) On what was the main cause for this slowdown, the RBI report states: “The pre-pandemic GDP growth has mainly been consumption-led. However, over the years, the share of consumption, the backbone of India’s economic growth, has been declining…”
Regular readers of ExplainSpeaking will recall that private consumption expenditure (PFCE in CHART 1) is the biggest engine of India’s GDP growth, accounting for 55% of India’s annual GDP. As can be seen in CHART 1, the PFCE component had lost its growth momentum rather sharply — from 7.5% to 6.2%.
CHART 2 shows the same reality in a line graph. While other engines of GDP growth such as government expenditure (or GFCE) and investments (or GFCF) were largely stagnant, private final consumption expenditure (or PFCE) was declining sharply.
 Chart 2: PFCE component had lost its growth momentum rather sharply
In other words, people’s demand was decelerating and this was showing up in a broad-based slowdown even before the pandemic struck the economy. Recall, how much of 2019 was dominated by news of sales of different goods such as new cars floundering.
3) and 4) On what contributed to lower consumer demand, the RBI states: “The decline in employment in general, and the depressed employment in the construction sector resulted in low rural wages (CHARTs 3 and 4). This along with high household leverage in 2017-18 and 2018-19 and domestic shocks pulled down consumption demand.”
On employment, as CHART 3 shows, the declining trend in employment started in 2018 — long before Covid.
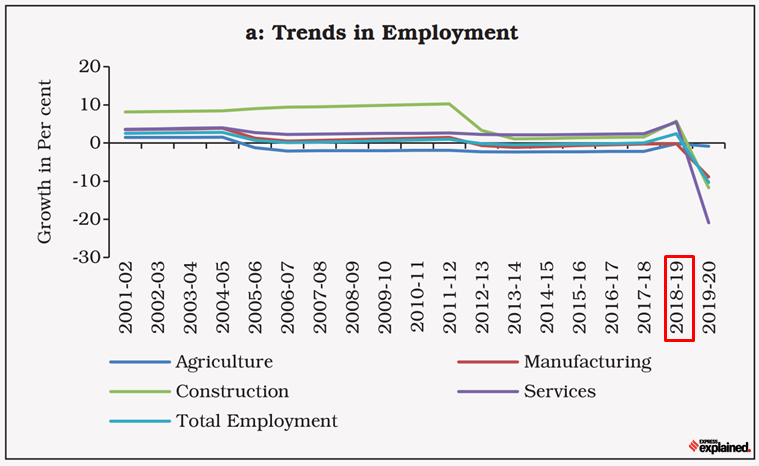 Chart 3: The declining trend in employment started in 2018
Similarly, rural wages lost their growth momentum in late 2017.
Contrast these statements with what the government had been stating during that phase. On employment, for instance, in early 2019, the government tried to run down its own Period Labour Force Survey, which showed that unemployment had reached a four-decade high.
On economic growth, the Budget speeches of this period are a good indicator of how the government was in denial.
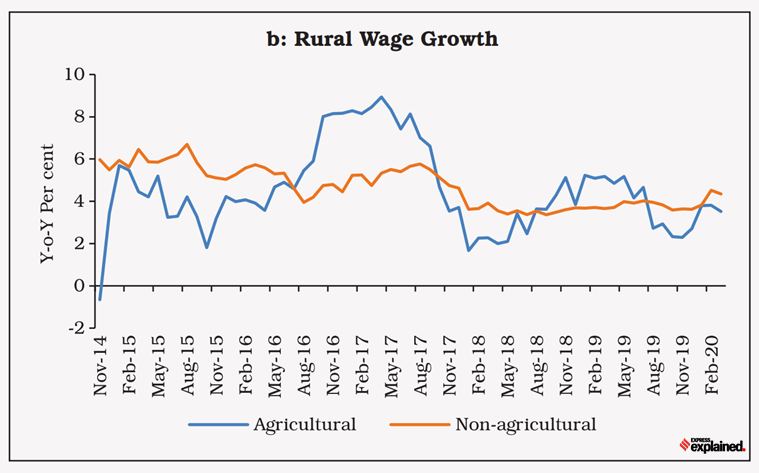 Chart 4: The depressed employment in the construction sector resulted in low rural wages
On February 1, 2018, then Finance Minister Arun Jaitley said: “When our Government took over, India was considered a part of fragile 5…The Government, led by Prime Minister, Shri Narendra Modi, has successfully implemented a series of fundamental structural reforms. With the result, India stands out among the fastest-growing economies of the world.”
On July 5, 2019, Finance Minister Nirmala Sitharaman stated the following during her first Budget speech immediately after the 2019 general elections: “The people of India have validated the two goals for our country’s future: that of national society and economic growth.”
This divergence between reality and how the government viewed the economy had policy implications. Take, for instance, the government’s decision to provide a massive tax cut to companies via the historic Corporate tax cut in 2019. This was done to incentivise investments and boost the overall supply in the economy. But, as the data has shown above, the problem in the Indian economy in 2019 was that of faltering consumer demand. If the government was not in denial, instead of giving a tax cut to the corporate sector, it could have either used those revenues to boost spending on the poor or given a similar-sized tax cut to average consumers, thus raising their purchasing power and overall demand.
The present
The government’s denial has continued even in the immediate aftermath of the Covid pandemic when it failed to acknowledge the uneven and iffy nature of economic recovery.
Sample what the Finance Minister said during her latest Budget speech earlier in February: “The overall, sharp rebound and recovery of the economy is reflective of our country’s strong resilience. India’s economic growth in the current year is estimated to be 9.2 per cent, highest among all large economies.”
While factually this might have been correct, the truth was that India was one of the worst affected economies during the Covid pandemic — something that the latest RBI report also brings out.
CHART 5 shows that India was one of the worst affected on the economic front.
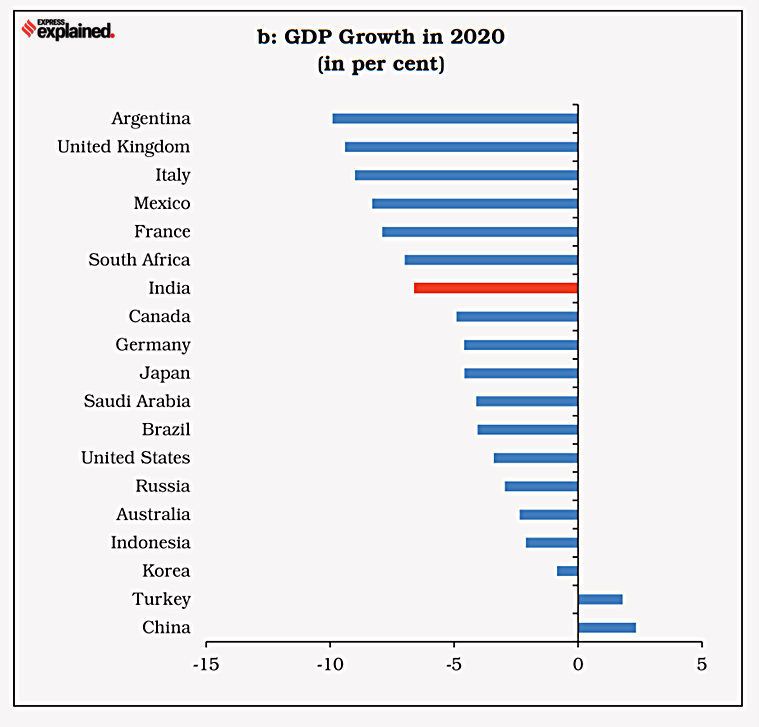 Chart 5: Countries ranked higher in terms of stringency Index – India, Argentina, Italy and the United Kingdom – faced deeper contraction in GDP
“A number of factors worked in conjunction to culminate into the most severe economic impact for India, with the stringency of the lockdown as the most cited reason. India imposed one of the most stringent lockdowns in the world in 2020 to curb the spread of the virus. Countries ranked higher in terms of stringency Index – India, Argentina, Italy and the United Kingdom – faced deeper contraction in GDP,” states the RBI report.
But while more stringent lockdowns ruined the economy, they did not prevent India from becoming the second worst-affected country health-wise (see CHART 6).
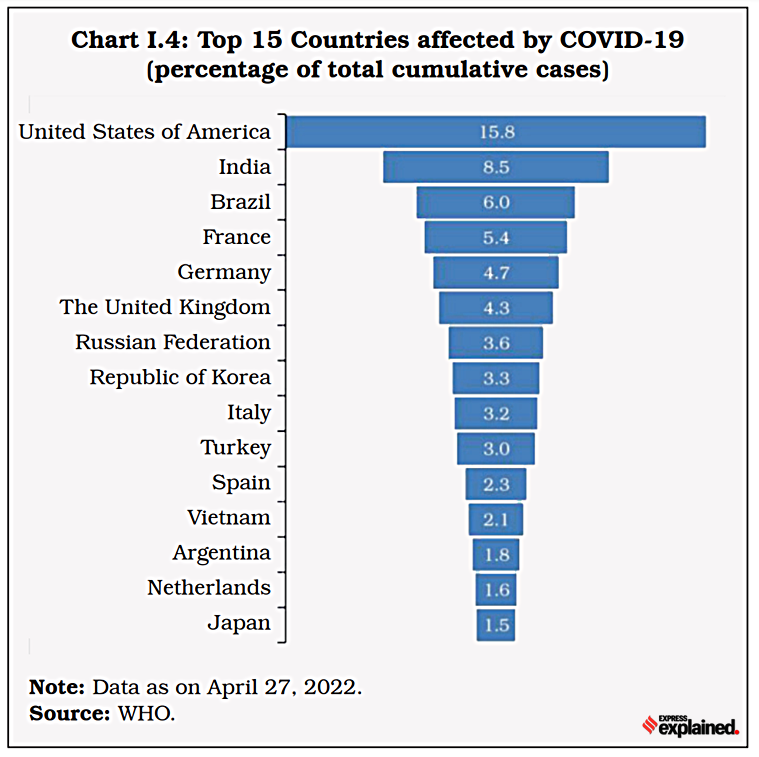 Chart 6: There is credible evidence to suggest that India has severely underestimated the Covid death count
On the health front, there is credible evidence to suggest that India has severely underestimated the Covid death count.
On the economic front, for the most part, the government has been incorrectly promoting the notion that India has staged a “V-shaped” economic recovery. The truth is far from it as shown by CHART 7.
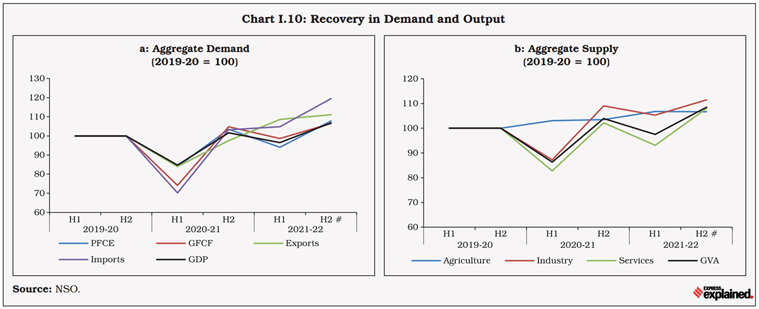 Chart 7: What these charts show is that, even now, the total demand and supply in the Indian economy have barely increased
In these two charts — one each for aggregate demand and supply — the 2019-20 level has been taken as 100. What these charts show is that, even now, the total demand and supply in the Indian economy have barely increased. “GDP in 2021-22…is estimated to be only 1.8 per cent above pre-pandemic level suggesting lost growth over two years,” states the RBI report.
What’s worse, even this average recovery hides an uneven (or K-shaped) nature of the actual recovery (see CHART 8).
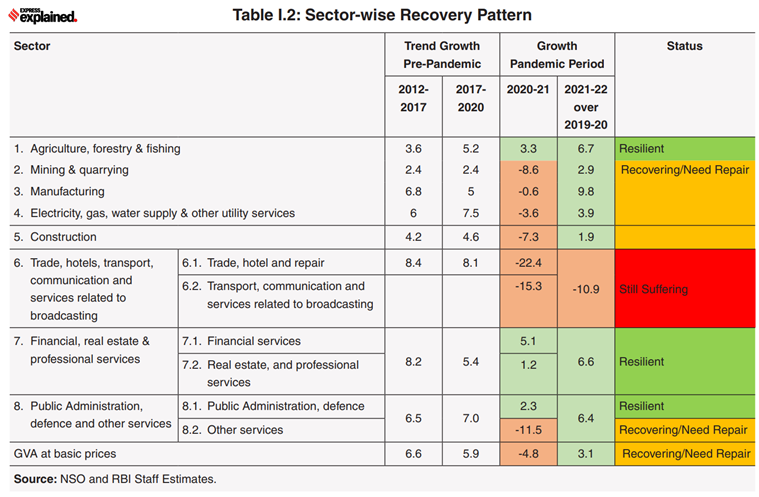 Chart 8: The average recovery hides an uneven (or K-shaped) nature of the actual recovery
Again, on employment, while the government continues to deny the stress in the Labour market, this is what the RBI report had to say: “The Indian labour market witnessed a sharp deterioration during the first wave of the pandemic with unemployment rate touching a record high and the labour force participation rate plummeting”. CHART 9 not only shows the fall in labour force participation rate but also in the employment rate. Not surprisingly, the demand for MGNREGA jobs continues to be higher than even the pre-Covid levels.
 Chart 9: The demand for MGNREGA jobs continues to be higher than even the pre-Covid levels
The future
The government’s repeated contention has been that India has registered a “v-shaped” recovery. But, as explained in one of the past pieces, an economy is said to have had a v-shaped recovery if its absolute level of GDP goes back to where it would have been had there been no fall. In other words, if the GDP had gone back to the pre-Covid growth trajectory (or path). As things stand, India is barely able to regain the levels set in 2019-20. This point becomes clearer in the next chart.
CHART 10 shows how RBI suspects India’s recovery may pan out. The blue line is the pre-Covid growth path of absolute GDP. The red line is the post-Covid path. A genuine “V-shaped” recovery would have meant that after ducking in 2020-21, the red line would have shot up so sharply in 2021-22 to rejoin the blue line.
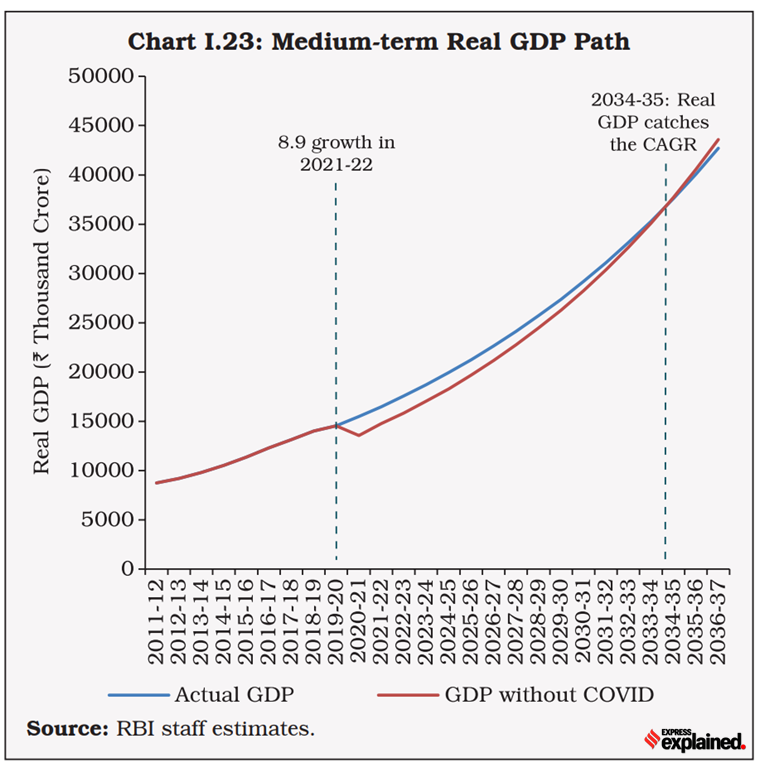 Chart 10: The blue line is the pre-Covid growth path of absolute GDP. The red line is the post-Covid path
What the RBI’s chart shows is that this process will take another 12 years.
But there is a big assumption in what the RBI states: “Taking the actual growth rate of (-) 6.6 per cent for 2020-21, 8.9 per cent for 2021-22 and assuming a growth rate of 7.2 per cent for 2022-23, and 7.5 per cent beyond that, India is expected to overcome COVID-19 losses in 2034-35”
The RBI expects India to grow at an average of 7.5% each year between 2023 and 2035 for India to achieve this trajectory.
But a look at India’s history suggests that this is a very optimistic assumption.
CHART 11 maps India’s growth rate since 1951 while carefully outlining the different phases of growth. In all of India’s history, only during one phase — between 2004 and 2012 — has India registered an average annual GDP growth rate of 7%.
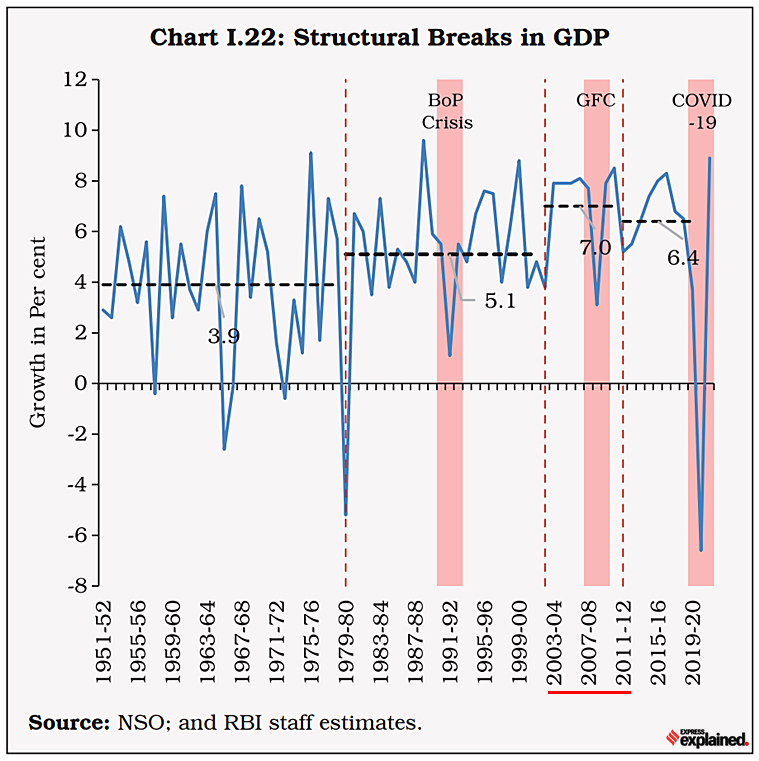 Chart 11: Only during one phase — between 2004 and 2012 — has India registered an average annual GDP growth rate of 7%
To expect that India will grow at 7.5% over the next 12 years when in the run-up to Covid India’s growth rate was decelerating fast — falling below 4% in 2019-20 — is hugely optimistic.
Already, the risks are stacked against it. Take the example of the ongoing war in Ukraine and how it has upended the global economy or the fact that the Covid pandemic isn’t completely over.
Do you think India will be able to regain its pre-Covid trajectory by 2035? Did the government miss a trick by staying in denial about India’s pre-Covid slowdown?
Share your views and queries at udit.misra@expressindia.com
Stay safe,
Udit
[ad_2]
Source link


